In November 2026, a team using South Africa’s MeerKAT radio telescope reported a measurement of how neutral hydrogen was distributed across large stretches of space about 4.5 billion years ago. The 64 dishes stood near Carnarvon in the Northern Cape, but the decisive work was in how their observations were compared. The MeerKAT Large Area Synoptic Survey, or MeerKLASS, made separate maps of the same patch of sky and looked for patterns that survived across them. The study appeared online on 3 November; on 10 November the Astronomical Observatory of Trieste explained how the observations and analysis recovered a signal far fainter than the radio emission in front of it. [1] [2] [3]
The telescope records a radio signal emitted by neutral hydrogen. In a laboratory that signal has a wavelength of about 21 centimetres. As the universe expands, the wavelength of light travelling through it stretches. A longer wavelength, or lower frequency, can therefore tell astronomers something about how far back in the universe’s history they are looking. MeerKLASS examined frequencies from roughly 971 to 1,024 megahertz, centred on a period the paper describes by a redshift of about 0.42. Sorting the observations by frequency lets astronomers distinguish signals from different depths; pointing the dishes at different parts of the sky lets them distinguish directions. [1] [3] [4]
The researchers did not need to see every galaxy. In intensity mapping, the signal collected from a patch of sky includes the combined glow of hydrogen in many galaxies that the telescope cannot resolve in that mode. Imagine dividing a radio map into boxes with a direction on the sky and a band of frequencies. Each box records an intensity, and the pattern across boxes carries information about clustering. The paper measures how much the brightness varies on different spatial scales. A power spectrum is a way of summarising that variation. It can show that hydrogen is more or less clustered at particular scales without naming the galaxies that supplied it. [1] [4]
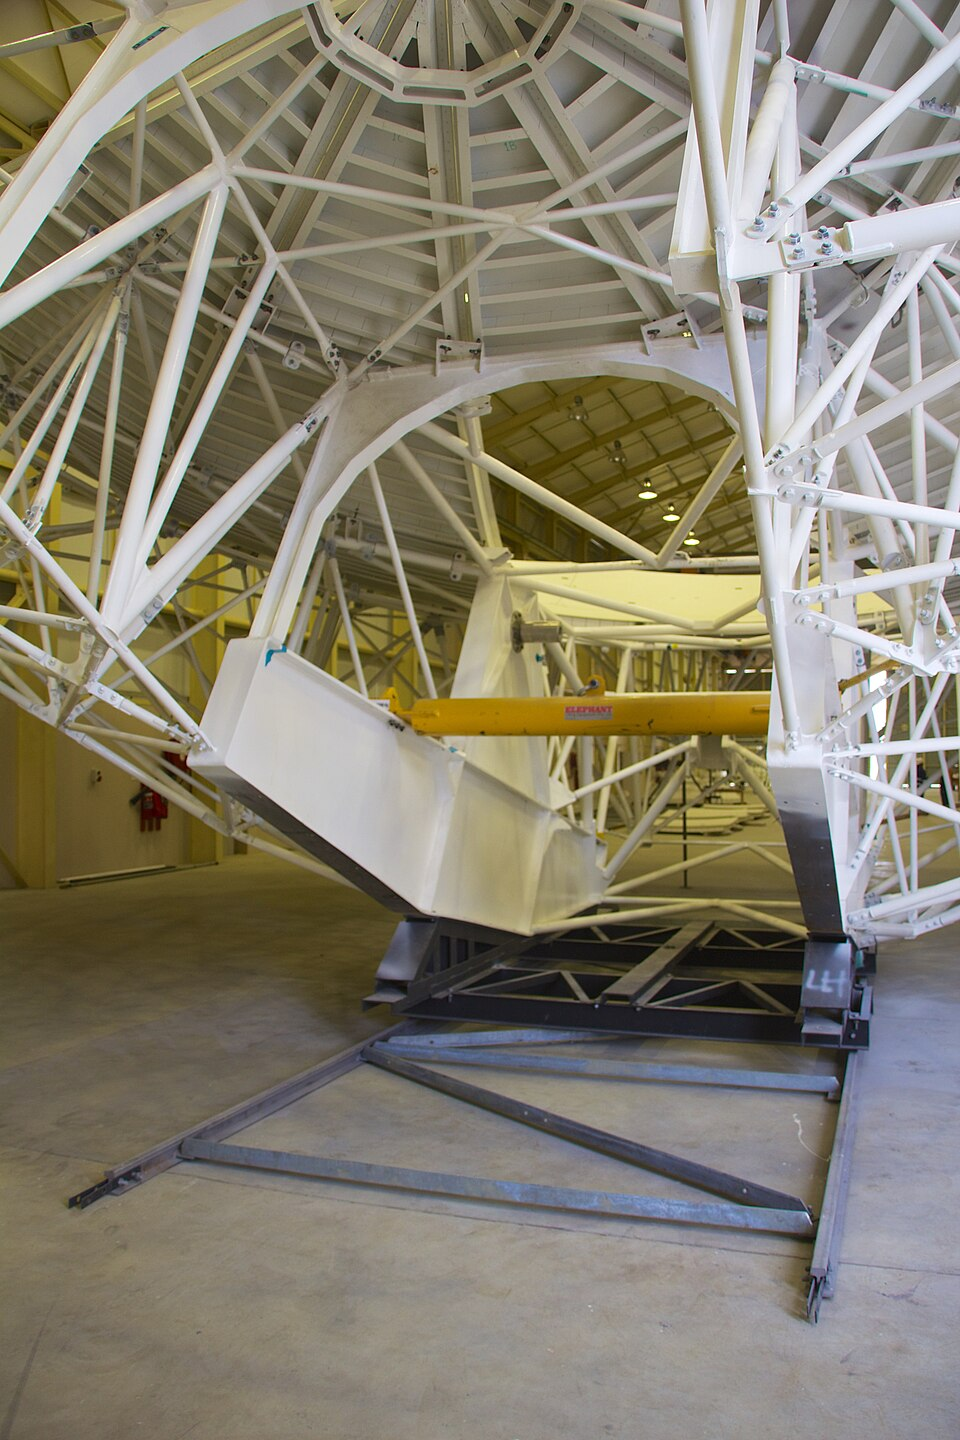
There was a time when MeerKAT’s capacity to make such observations existed only in requirements, drawings and hardware under assembly. Mike Peel’s photograph of the antenna assembly hangar in June 2014 shows parts of the first dish at the site north of Carnarvon. It records the construction stage of the actual instrument, years before the hydrogen observations. By the inauguration in July 2018, the South African Radio Astronomy Observatory had built the full 64-dish telescope and begun operating it. The inauguration featured a radio panorama of the centre of the Milky Way. That detailed image relied on combining signals from pairs of dishes, the approach for which radio arrays like MeerKAT are best known. [5] [6] [7]
For this survey the team used a different capability of the same hardware: the dishes recorded separately. Combining signals from dish pairs is good for seeing small details; recording the total signal through each dish is useful for measuring patterns that extend across large areas, at the cost of a blurrier view. The 2018 call for telescope time already described MeerKAT’s observing capabilities and how researchers could gain access. The research that followed depended on turning that installed capacity into observing strategies and calibration software. Using an array in single-dish mode was a choice about which features of the sky to preserve, with consequences for how the measurements would later be checked. [1] [3] [5] [8]
The technical record helps explain why the difference between observing modes matters. During commissioning, engineers tested the paths that radio signals take from the dish and receiver through the electronics and into the digital system. The tests showed that the array could form useful images; the engineering team also reported that its digital system could connect to equipment supplied by researchers. In the hydrogen survey, each dish instead supplied a stream of measurements for making a broad survey map. A telescope that can make a sharp picture and a telescope that can reliably measure very faint large-scale brightness pose different engineering challenges, even when they use the same dishes. [1] [5] [6]
Between September and December 2021, the team repeatedly scanned the same sky field, covering about 236 square degrees. The dishes swept from side to side at a fixed elevation. Scans made as the field rose and set crossed it in different directions, so the team did not have to rely on any one pass. Before and after a scan, observers tracked a bright source whose radio signal could be used as a reference. A device that added a known signal at regular intervals helped them calibrate the receivers during the scan. Of roughly 60 hours of observations, around 40 remained after the researchers flagged interference. [1]
Removing radio interference still leaves a difficult problem: emissions from our own galaxy and other foreground sources can be much brighter than the hydrogen signal. Much of that foreground brightness varies smoothly with frequency. The researchers used that behaviour to identify and remove dominant patterns from the maps. The removal can also take away real hydrogen signal. A map that looks cleaner is therefore insufficient evidence of a more accurate measurement. The analysis allowed for possible signal loss when estimating the strength of clustering, and the earlier MeerKLASS methods literature describes how changes in foreground removal can change the scales on which a measurement is credible. [1] [3] [4]
Frequency also introduces a problem for comparing maps. A dish does not see exactly the same width of sky at every frequency. A bright source can therefore leave a changing imprint across a set of maps even when the underlying emission varies smoothly. The MeerKLASS methods literature examines how differences in the beam and choices about smoothing or foreground subtraction can alter the inferred structure. In the new study, the team used tests along the frequency direction as well as across the sky to judge which scales to keep. That is why the reported measurement covers a defined band of spatial scales instead of claiming sensitivity to every feature the maps appear to contain. [1] [4]
Comparing separate sets of observations was the next step. Random receiver noise in one map is unlikely to form the same pattern in another, but a genuine pattern in the sky should recur. The researchers divided their observations into groups and processed them separately before comparing their maps. Some spectra estimated from individual groups contained excess power the authors could not fully explain. The spectra derived by comparing groups fared better in tests. That mattered because these comparisons cannot automatically remove an error shared by every set of maps. The team tested the effects of processing choices and restricted its claim to the range of scales it judged reliable. [1] [2]
Earlier MeerKLASS studies had looked for agreements between the array’s hydrogen maps and independent surveys of galaxies. That method gave scientists a way to see whether the radio observations traced the same cosmic structure as the galaxy catalogues. It also depended on having a galaxy survey that overlapped the radio observations. This time the main estimate came from comparing MeerKAT observations with one another. The authors still used an external galaxy catalogue as a check. The independent evidence helped test the interpretation; the hydrogen estimate itself did not require using that catalogue to generate the signal. [1] [4]
This earlier work also puts the figures in perspective. The survey team’s pilot study compared about ten and a half hours of MeerKAT observations with a catalogue from the WiggleZ Dark Energy Survey. Later work used data overlapping the GAMA galaxy survey and tested ways of separating foregrounds on different scales. Those comparisons helped establish that the radio maps carried information about cosmic structure. A detection statistic from one of those comparisons cannot be ranked directly against the new statistic: the teams asked different questions of overlapping but different measurements. The advance in the new paper is that the estimate comes from the hydrogen observations themselves. [1] [4]
The study reports a signal-to-noise ratio of 6.2 for the measurement in the analysed range. That describes the strength of the signal relative to estimated noise under this analysis. It is separate from the question of how precisely the team knows how much hydrogen is present. The measured clustering strength depends both on hydrogen abundance and on how closely the gas traces the underlying distribution of matter. The authors report a constraint on a combination of those two quantities, with sizeable uncertainty. The work establishes a way of making the measurement with this array and dataset; it does not yield an exact cosmic inventory. [1] [2]
SARAO built and operates the telescope. The survey is led by Mário Santos at the University of the Western Cape, and the paper’s contribution statement records separate work on calibration, making the maps and estimating their spectra. Collaborators at other institutions contributed to those stages. Reading the commissioning and research records together makes the division of work visible: the Karoo was the place of observation, South African institutions were involved in developing and running the instrument and survey, and the analysis was shared across a wider team. The place where the data were collected is part of the explanation, alongside the work that converted those data into evidence. [1] [3] [5] [9]
SARAO says the survey has been collecting lower-frequency observations since 2023, reaching light emitted earlier in cosmic history. Researchers envisage surveys of a much larger volume, but that is a programme of future work. Larger surveys need reliable techniques for removing interference and foregrounds as well as more time looking at the sky. The telescope’s next contribution will depend on how these methods perform under different observing conditions and whether the measurement can be repeated over a wider range of distances and scales. [1] [4] [9]
The construction photograph shows where the story began. The 2026 paper shows what the instrument made possible once researchers learned to use and check it in a different way. The most informative detail is that the same patch of sky kept yielding a measurable pattern when the team compared separate observations. That is what turns a faint radio glow into a way to study the universe from the Karoo. [1] [5] [7]
- [1]MeerKLASS Collaboration / arXiv. HI intensity mapping with MeerKAT: A measurement of the 21-cm auto-spectrum on cosmological scalesOctober 2026; observations September–December 2021
- [2]Monthly Notices of the Royal Astronomical Society. Hi intensity mapping with MeerKAT: A measurement of the 21-cm auto-spectrum on cosmological scales3 November 2026; journal record for the same study as [1]
- [3]INAF Astronomical Observatory of Trieste. MeerKAT maps cosmic hydrogen on large scales: a key contribution from the INAF Astronomical Observatory of Trieste10 November 2026
- [4]Astrophysics and Space Science. Revealing cosmological fluctuations in 21 cm intensity maps with MeerKLASS: from maps to power spectra2026
- [5]SKA Observatory. SKA precursor telescope MeerKAT inaugurated in South Africa13 July 2018
- [6]International Union of Radio Science / Justin Jonas. MeerKAT Commissioning and Early Science ResultsMarch 2019
- [7]Mike Peel / Wikimedia Commons. SKA site, South Africa 2014 39.jpg4 June 2014 (capture)
- [8]South African Radio Astronomy Observatory. Call for MeerKAT-64 open time proposalsDecember 2018
- [9]South African Radio Astronomy Observatory. MeerKAT maps hydrogen across large cosmological scales27 October 2026
Did this publication help you understand the topic?
0 voluntary responses. Browser-based participation; responses are not a representative survey.
We welcome suggestions, contributions and recommendations.
Editorial standards ↗